Google TPU v1
数据中心推理性能分析
Norman P. Jouppi, Cliff Young, Nishant Patil, David Patterson, et al.
Google, Inc.
ISCA 2017
Presenter: wzw
Date: 2026-04-27
三句话看懂
- 瓶颈: 数据中心
NN inference真正受限的不是峰值TOPS,而是 严格P99 latency下的有效吞吐。 - 方法: TPU v1 用
256×256systolicINT8MXU +28 MiBsoftware-managed on-chip memory + 极简确定性执行模型,主动放弃通用处理器特性。 - 结果: 在 Google 生产 workload 上,TPU 相对同时代
K80达到13.2×几何均值、15.3×加权均值性能提升,performance/Watt达25× ~ 29×。
背景:线上推理
- 论文评测的
2×MLP + 2×LSTM + 2×CNN覆盖 Google 当时95%的 datacenterNN inference需求。 - 这些应用大多是 user-facing services,核心约束是
99th-percentile response time,不是离线大 batch 吞吐。 - 量化后的 inference 已能稳定使用
8-bit运算;作者的判断是:训练继续放在 GPU,推理值得做专用 ASIC。
GPU 为什么没赢
| Platform | Batch | 99th% latency | IPS | % Max IPS |
|---|---|---|---|---|
| CPU | 16 | 7.2 ms |
5,482 | 42% |
| GPU | 16 | 6.7 ms |
13,461 | 37% |
| TPU | 200 | 7.0 ms |
225,000 | 80% |
- 以
MLP0为例,应用给出的时延预算只有7 ms。 K80的优势建立在高吞吐、大 batch、多线程隐藏延迟上;一旦时延封顶,很多峰值能力根本用不上。- 所以在真实 inference 中,
K80只比Haswell略快,远没有训练场景那种代际优势。
关键观察
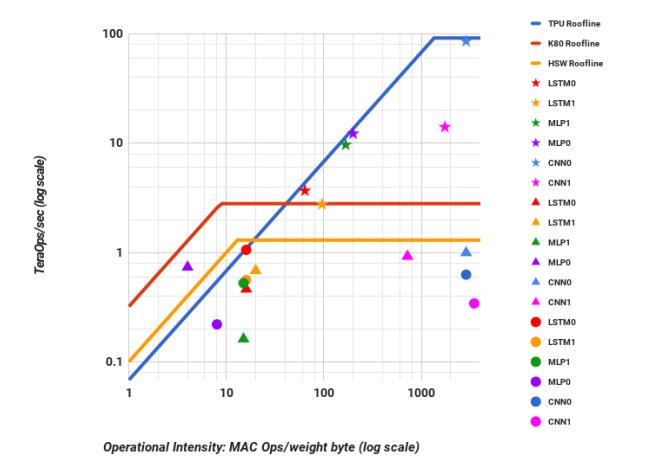
Fig.8说明 TPU 的 6 个 workload 都高于 CPU/GPU roofline,但4/6仍是 memory-bound。- 关键洞察是:低利用率的大资源,只要足够便宜,仍能赢。
- 所以 v1 优先堆
INT8 MAC和片上 SRAM,而不是复杂控制。
总体架构
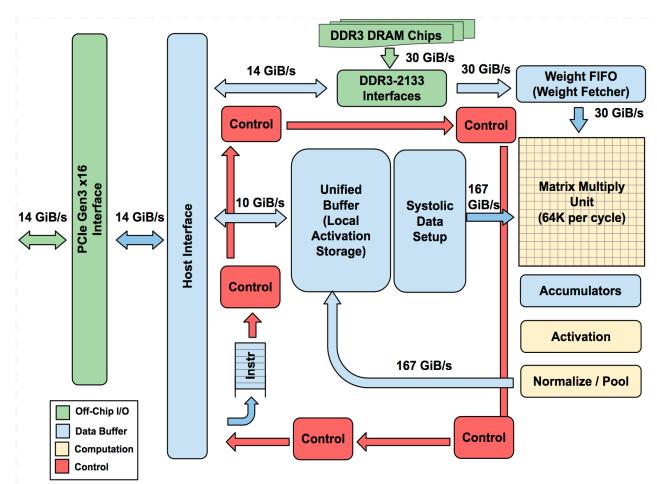
- Host 经
PCIe Gen3 x16下发指令;TPU 更像矩阵FPU coprocessor,而不是小型 GPU。 - 数据通路很直接:
Weight Memory -> FIFO -> MXU -> Accumulators -> Activation -> Unified Buffer。 - 目标是 run whole inference models on TPU,减少 host 参与和抖动。
芯片预算
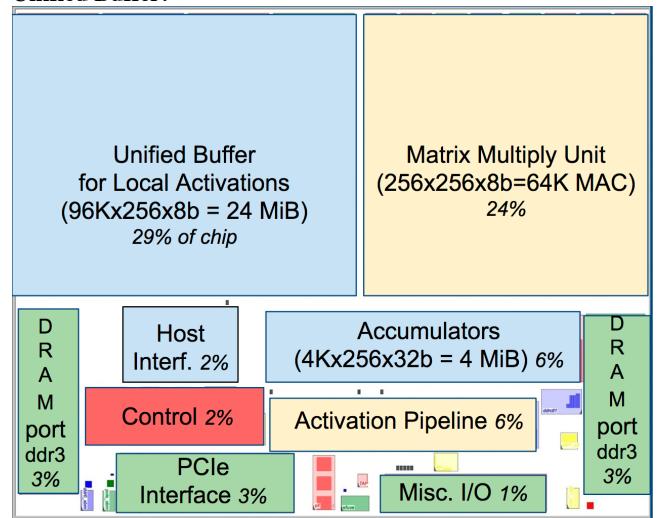
24 MiB Unified Buffer占 die 近1/3,Matrix Multiply Unit占约1/4。- 整个 datapath 占 die 的
67%,而 control 只有2%。 - 这正是 TPU 的设计哲学:把面积给数据路径,不给 speculation / OoO / cache hierarchy。
MXU:核心算子
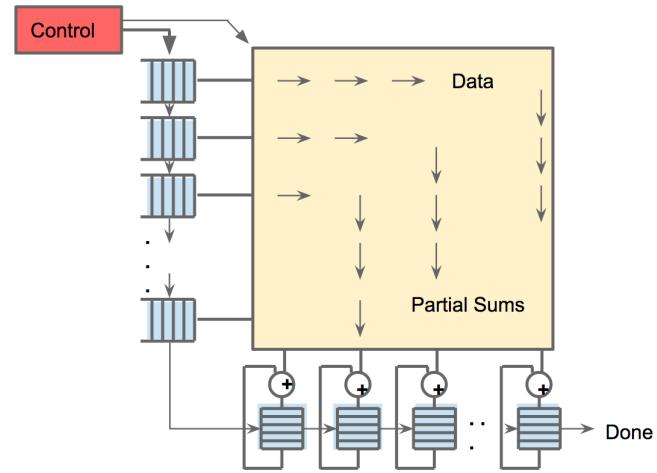
- 核心是
256×256 = 65,536个INT8 MAC,峰值92 TOPS。 systolic execution的目的不是“酷”,而是减少大 SRAM 的读写次数,把数据重用固化在数据流里。- 这也是为什么 TPU 能在仅
40 W忙时功耗下塞进远多于K80的 MAC 数量。
显式存储层次
Weight Memory是片外8 GiBDRAM,权重经Weight FIFO分块流入 MXU;这决定了很多 workload 最终受制于 weight bandwidth。- 片上有
24 MiB Unified Buffer + 4 MiB Accumulators,完全是 software-managed memory,不是传统 cache。 - 指令也刻意偏
CISC:Read_Host_Memory / Read_Weights / MatrixMultiply / Activate / Write_Host_Memory,目的是减轻PCIe指令带宽压力。
一次推理怎么走
- Step 1: Host 把输入激活搬到
Unified Buffer,并把本层指令序列发给 TPU。 - Step 2:
Read_Weights将当前 tile 的权重从Weight Memory预取到Weight FIFO。 - Step 3:
MatrixMultiply/Convolve在256×256MXU 上生成部分和,写入Accumulators。 - Step 4:
Activate完成ReLU/Sigmoid/Pooling等后处理,再写回Unified Buffer或 host,进入下一层。
硬件账单
| Chip | Die | Busy Power | Peak TOPS | On-chip Memory |
|---|---|---|---|---|
| Haswell | 662 mm² |
145 W |
2.6 |
51 MiB |
| K80 die | 561 mm² |
98 W |
2.8 |
8 MiB |
| TPU | <331 mm² |
40 W |
92 |
28 MiB |
- TPU die 不到 Haswell 一半面积,忙时功耗也明显低于 K80。
- 但它拥有 25× K80 的 MAC 数量,以及 3.5× 的 on-chip memory。
- 这不是“魔法工艺”,而是因为作者明确牺牲了通用处理器最贵的那部分复杂性。
方法学
- Platforms: 2015 datacenter 可部署平台,要求有
SECDED与服务器级配置,不拿消费卡或研究原型凑数。 - Workloads: Google 生产环境的
MLP/LSTM/CNN,并按真实业务占比做 weighted mean。 - Metrics: 不是只看 kernel 吞吐,而是同时看
roofline、P99 latency、host overhead、performance/Watt。 - Alternative design: 论文还建立 TPU performance model,分析 memory bandwidth、clock、matrix size 等参数变化。
主结果:性能
| Metric | GPU vs CPU | TPU vs CPU | TPU vs GPU |
|---|---|---|---|
| Geometric Mean | 1.1× |
14.5× |
13.2× |
| Weighted Mean | 1.9× |
29.2× |
15.3× |
- 最强的样例并不是 CNN 独占:TPU 对
MLP0和CNN1分别可到41×和71×CPU。 - 但收益并不均匀,
LSTM1只有1.2× CPU,说明 workload shape 仍然非常关键。 - 论文最扎实的一点是:这些数字已经包含 host server overhead,而不是只报裸 kernel。
能效:真正的商业理由
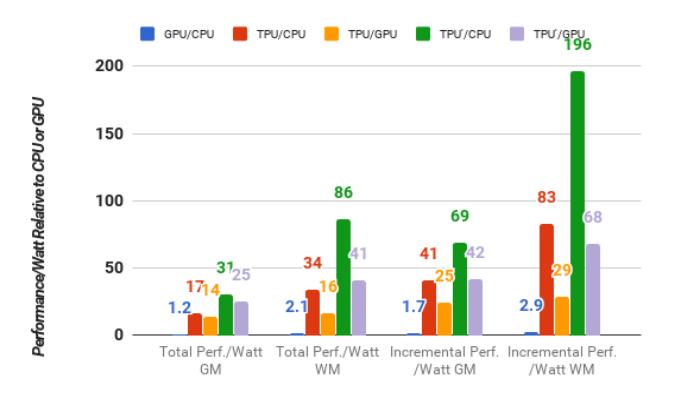
- 相对
Haswell,TPU server 的 total performance/Watt 达到17× ~ 34×。 - 相对
K80,TPU 的 incremental performance/Watt 达到25× ~ 29×。 - 作者明确把
performance/Watt当作performance/TCO的代理指标。
真瓶颈在哪
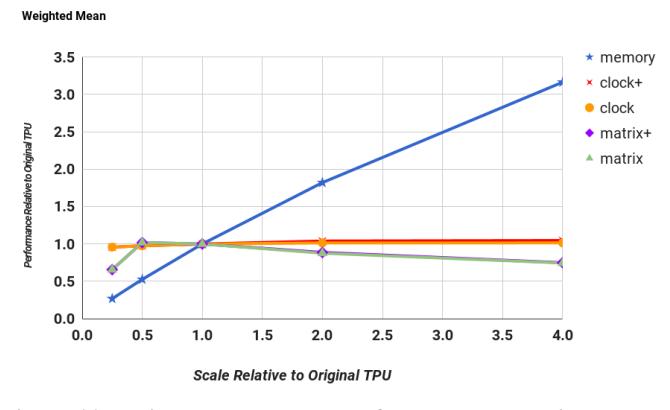
Fig.11最重要的结论:把 memory bandwidth 提高4×,平均性能约增3×;单纯提高频率几乎没用。- 甚至把矩阵阵列从
256×256盲目放大到512×512还可能变慢,因为 tile fragmentation 更严重。 - 换句话说,TPU v1 的第一瓶颈不是 MAC 数量,而是 weight memory bandwidth。
只换内存会怎样
- 作者构造了一个假想
TPU':基本不改计算核心,只把DDR3 Weight Memory升级成GDDR5。 - 结果非常直接:几何均值 speedup 提升到
2.6×,加权均值到3.9×;计入 host overhead 后仍有1.9× / 3.2×。 - 这说明 TPU v1 的工程约束不是“没想到”,而是 15 个月交付周期 下优先做出了最小可部署版本。
弱点与反例
- CNN1 是负教材: 虽然 operational intensity 高,但 TPU 只跑到
14.1 TOPS;根因是浅 feature depth、28.1%weight stalls 与22.8%RAW stalls。 - 能量比例性差: TPU 在
10%负载时仍消耗88%满载功耗,明显不如 CPU/GPU。 - 结论依赖 workload mix: 这篇论文最强的适用域是 Google 2015-2016 latency-sensitive inference,不是所有 NN 场景的普适终局。
总结
- TPU v1 最重要的贡献,不是“做了个更快的 NN chip”,而是第一次把 datacenter inference 的正确优化目标定成
P99 latency under real deployment constraints。 - 架构上,它用 大而不太大的
INT8systolic MXU + substantial software-managed memory + deterministic execution 换到了数量级收益。 - 方法论上,它告诉后来的 AI accelerator:先搞清楚瓶颈是 tail latency、memory bandwidth、还是 compiler mapping,再决定堆哪种硬件资源。
我的评价
- 优点: 工业数据扎实,评价维度正确,负结果和局限也没有回避。
- 最强点: 论文把后续十年的几条主线都提前讲清楚了:
low precision、systolic array、managed SRAM、roofline、latency-oriented serving。 - 缺口: baseline 并非各自平台上的“终极优化版”;CPU 的
INT8路线和更新 GPU 平台没有系统展开。 - 后续: 如果把这篇 paper 和后来的
TPU v2/v3/v4连起来看,会更清楚地看到 Google 后续几代几乎都在补 memory system 和 scale-out fabric。